The Usage Page in the Greip dashboard offers valuable insights into the weekly usage of your subscription and API methods. This guide will walk you through the different sections and features of the Usage Page, helping you effectively analyze your usage and optimize resource allocation.

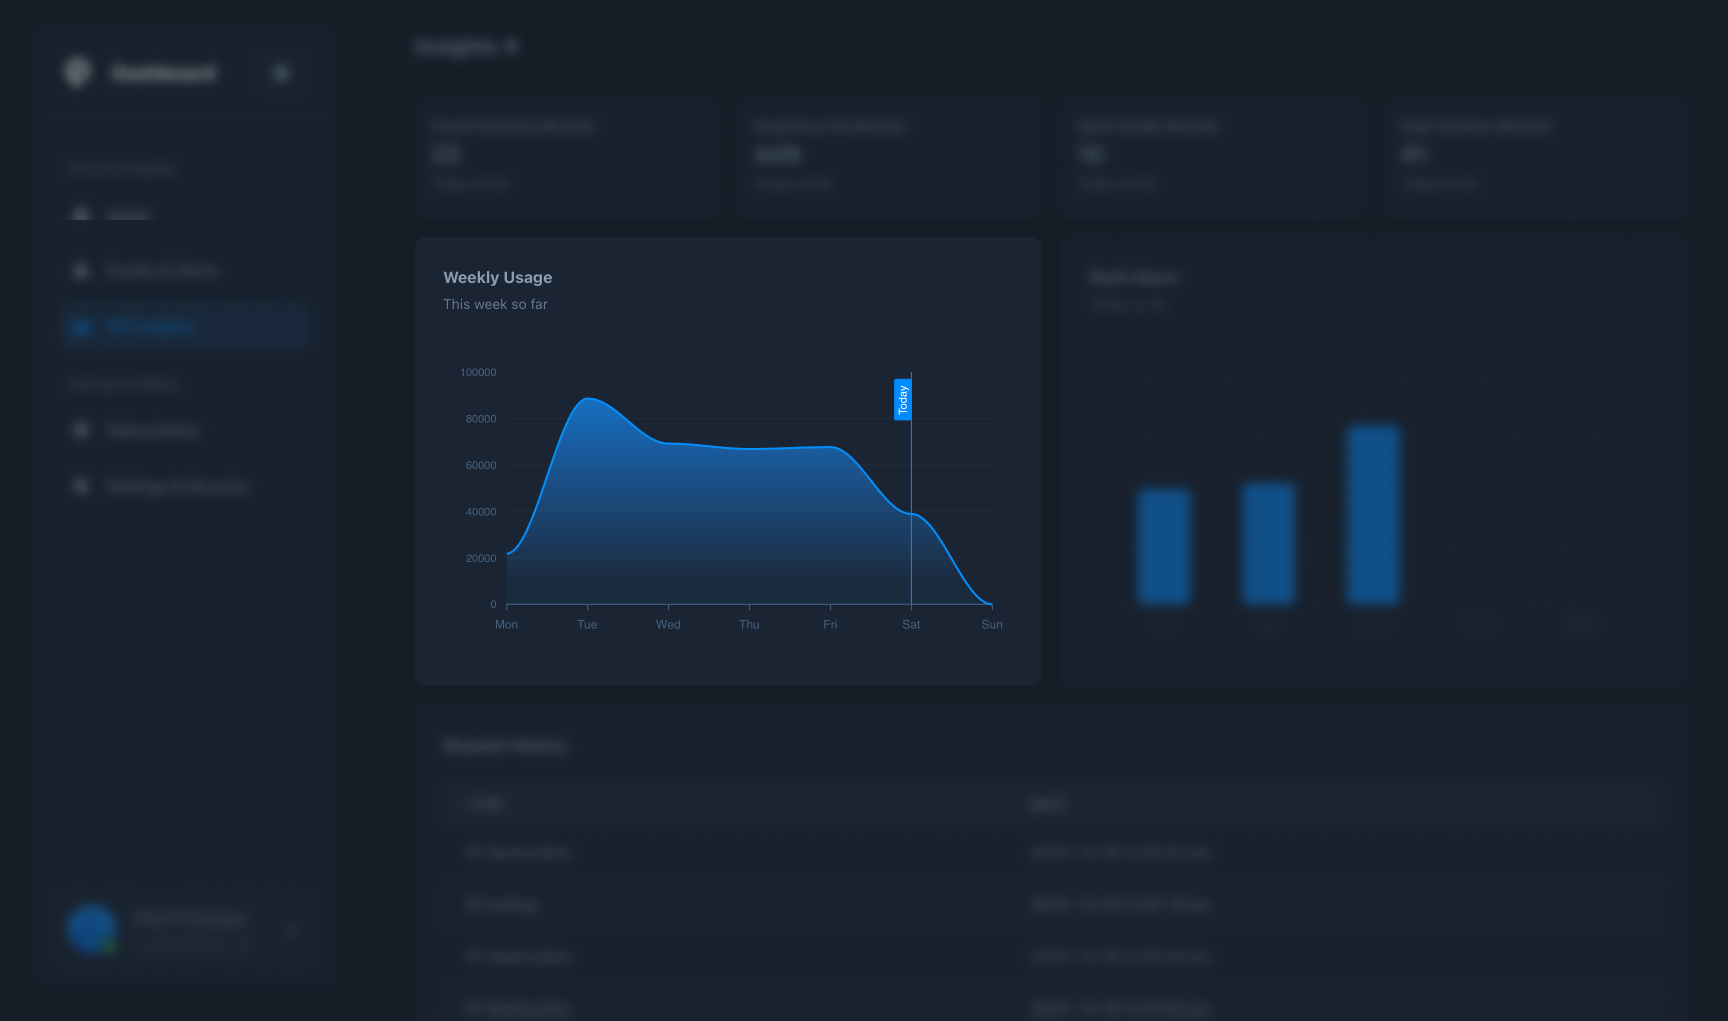
Weekly Usage Metrics
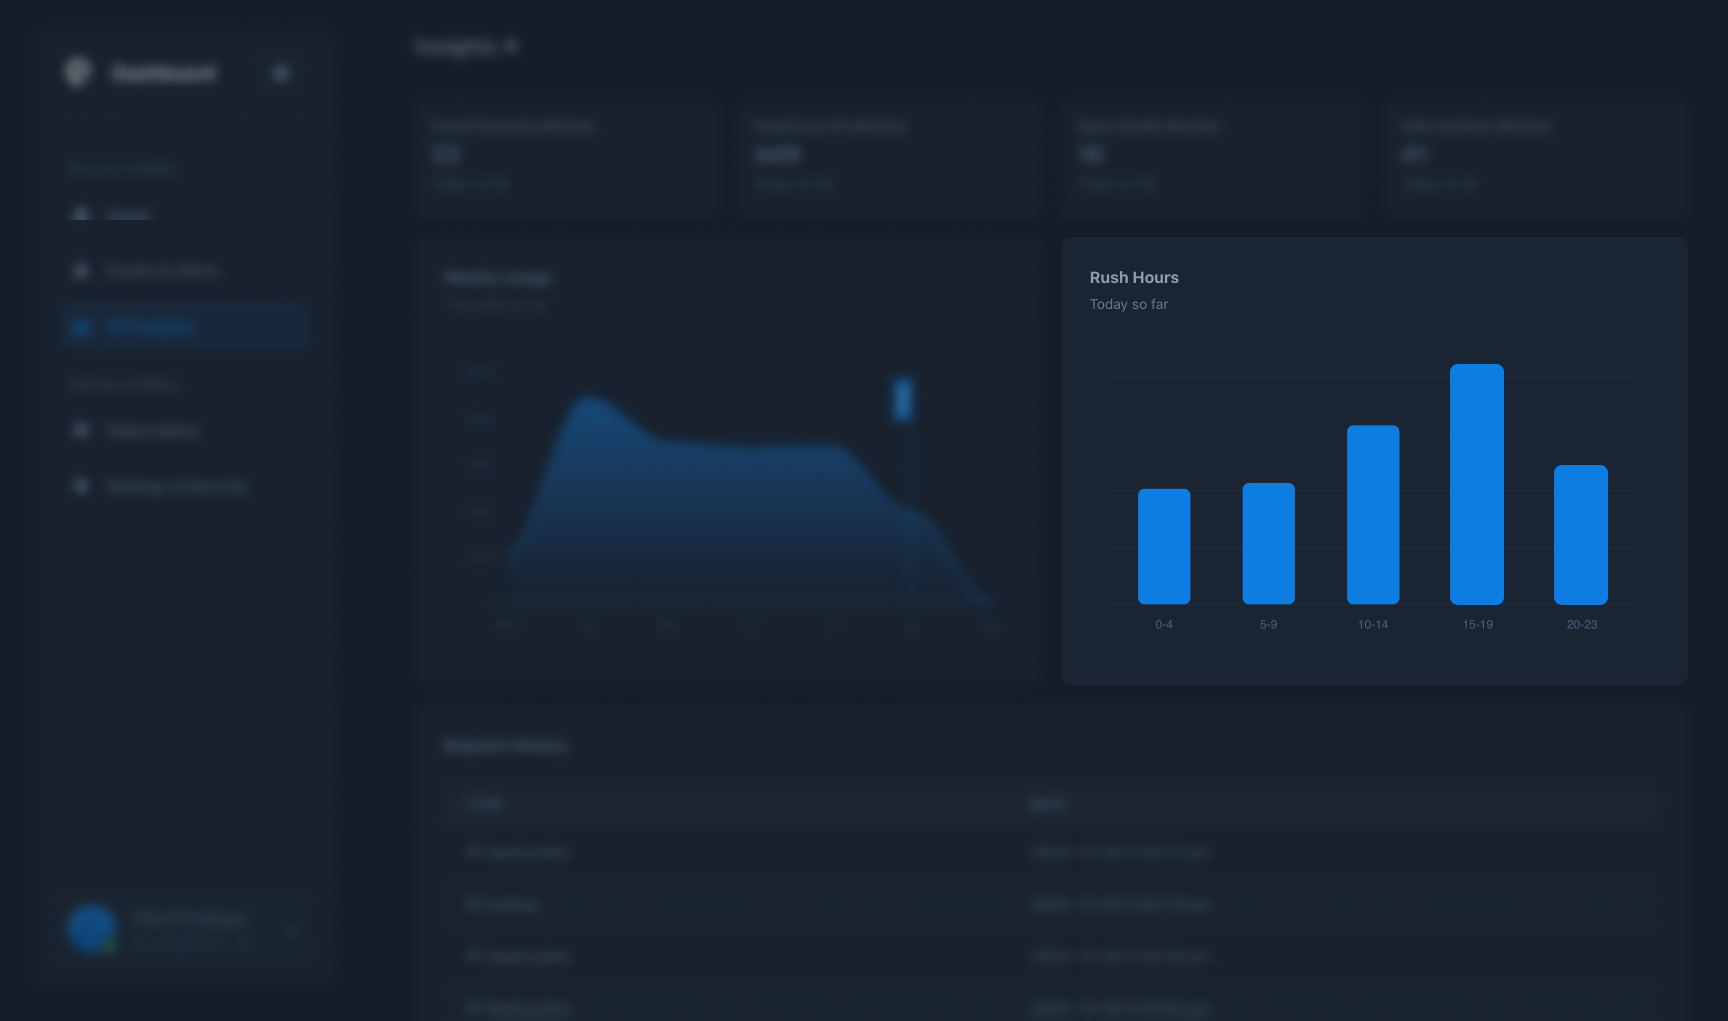
Greip Dashboard - Weekly API usage

Greip Dashboard - Weekly API usage

Upon accessing the Usage Page, you’ll find a bar chart that visualizes the weekly usage metrics of your Greip subscription. This chart provides an overview of the volume of API requests made over time, allowing you to track trends and patterns. By analyzing this data, you can identify peak activity periods (commonly known as rush hours) and evaluate resource allocation during those times.

Top API Methods

Greip Dashboard - Top used methods

Greip Dashboard - Top used methods

The Usage Page also contains a section dedicated to showcasing the top API methods used during the specified timeframe. This section provides insights into the functionalities within Greip’s fraud prevention modules that are most frequently utilized. By identifying the top API methods, you can focus on optimizing and refining these functionalities to meet your specific needs.

Identify Rush Hour

Greip Dashboard - Rush hour

Greip Dashboard - Rush hour

Identifying rush hours is crucial for optimal resource allocation and ensuring optimal service availability during high-traffic periods. To identify rush hours on the Usage Page, just take note of the time periods when API requests reach their peak, as these often correspond to rush hours when there is a higher volume of transactions or user interactions. Consider external factors such as marketing campaigns, sales promotions, or seasonal trends that may influence usage patterns.

Steps to Leverage the Information Effectively:

  1. Analyze Weekly Usage Trends: Monitor the line chart to identify patterns and trends in your API usage. Look for spikes or dips in the usage graph and correlate them with events or campaigns to gain insights into your business’s transaction volumes.
  2. Identify Rush Hours: Determine the time periods when your API requests reach their peak. This information can help you allocate resources more efficiently and ensure optimal service availability during high-traffic hours.
  3. Explore Top API Methods: Review the section highlighting the most utilized API methods. By understanding the functionalities driving the majority of your API usage, you can focus on optimizing and enhancing those specific features to deliver better fraud prevention outcomes.

Utilize the Usage Page to gain a deeper understanding of your Greip subscription’s usage patterns, identify key trends, and optimize resource allocation. By actively monitoring and analyzing your usage metrics, you can fine-tune your fraud prevention strategies, enhance performance, and maximize the value derived from Greip.